National shortage rankings
Healthcare Shortage Rankings
According to the Health Resources and Services Administration (HRSA) Data Warehouse, 21,148 active Health Professional Shortage Area designations were in force nationwide as of August 2026. This reference ranks U.S. states and counties across primary care, mental health, and dental care, helping readers compare recorded shortage burden rather than infer the quality of any clinician or facility.
The national ranking in one line
California is #1 of 56 states and territories with 1,623 active HPSA designations (4.3× the 378 average); Florida sets the top-10 cutoff at 637 designations.
- 1,623
- California active HPSAs (#1)
- #10
- Florida top-10 cutoff
- 4.3×
- leader vs state average
- 378
- average per state or territory
These are active HRSA designation counts, not a measure of clinician quality or a complete measure of local access.
States with the most HPSA designations
Total active Health Professional Shortage Area designations, top 10 states and territories.
- California
California
1,623 designations
- Texas
Texas
1,119 designations
- Alaska
Alaska
988 designations
- Missouri
Missouri
925 designations
- Michigan
Michigan
793 designations
- Illinois
Illinois
731 designations
- Kentucky
Kentucky
701 designations
- Arizona 649
Arizona
649 designations
- Washington 640
Washington
640 designations
- Florida 637
Florida
637 designations
State Rankings
Most Total HPSAs
Full list →| # | State | Total HPSAs |
|---|---|---|
| 1 | California | 1,623 |
| 2 | Texas | 1,119 |
| 3 | Alaska | 988 |
| 4 | Missouri | 925 |
| 5 | Michigan | 793 |
| 6 | Illinois | 731 |
| 7 | Kentucky | 701 |
| 8 | Arizona | 649 |
| 9 | Washington | 640 |
| 10 | Florida | 637 |
Most primary-care designations
Full list →| # | State | Designations |
|---|---|---|
| 1 | California | 559 |
| 2 | Texas | 394 |
| 3 | Missouri | 340 |
| 4 | Alaska | 330 |
| 5 | Illinois | 296 |
| 6 | Michigan | 274 |
| 7 | Kentucky | 245 |
| 8 | Florida | 229 |
| 9 | Arizona | 227 |
| 10 | Washington | 219 |
Most mental-health designations
Full list →| # | State | Designations |
|---|---|---|
| 1 | California | 518 |
| 2 | Texas | 387 |
| 3 | Alaska | 330 |
| 4 | Missouri | 259 |
| 5 | Michigan | 257 |
| 6 | Washington | 217 |
| 7 | Arizona | 212 |
| 8 | Kentucky | 210 |
| 9 | North Carolina | 207 |
| 10 | Florida | 204 |
Most dental designations
Full list →| # | State | Designations |
|---|---|---|
| 1 | California | 546 |
| 2 | Texas | 338 |
| 3 | Alaska | 328 |
| 4 | Missouri | 326 |
| 5 | Michigan | 262 |
| 6 | Illinois | 250 |
| 7 | Kentucky | 246 |
| 8 | Arizona | 210 |
| 9 | Florida | 204 |
| 10 | Washington | 204 |
County Rankings
Counties - Highest primary-care HPSA scores
View top 100 →Counties - Highest mental-health HPSA scores
View top 100 →| # | County | HPSA score |
|---|---|---|
| 1 | ClermontOH | 25.0 |
| 2 | CumberlandKY | 25.0 |
| 3 | LeonFL | 25.0 |
| 4 | MilwaukeeWI | 24.0 |
| 5 | KenoshaWI | 24.0 |
| 6 | McDowellWV | 24.0 |
| 7 | Not DeterminedMH | 24.0 |
| 8 | DarlingtonSC | 24.0 |
| 9 | CharlestonSC | 24.0 |
| 10 | LexingtonSC | 24.0 |
Counties - Highest dental HPSA scores
View top 100 →| # | County | HPSA score |
|---|---|---|
| 1 | McDowellWV | 26.0 |
| 2 | BerkeleyWV | 26.0 |
| 3 | MocaPR | 26.0 |
| 4 | San SebastianPR | 26.0 |
| 5 | UtuadoPR | 26.0 |
| 6 | LoizaPR | 26.0 |
| 7 | AdjuntasPR | 26.0 |
| 8 | MayaguezPR | 26.0 |
| 9 | JayuyaPR | 26.0 |
| 10 | GuayanillaPR | 26.0 |
What to do with these rankings
California carries 4.3x the average state's designation count, a rank alone does not tell you why.
- Drill into California's own designations to see which shortage type (primary care, mental health, or dental) is driving its rank. California overview
- A state or county's designation COUNT reflects both severity and population size, check the per-capita shortage rate before assuming the top-ranked area has the worst individual access. How rankings are built
- See whether a specific county clears HRSA's population-to-provider threshold behind its own HPSA score. HPSA score lookup
Rankings reflect ACTIVE designations only; withdrawn or expired HPSAs are excluded. HRSA reviews designations quarterly, so relative order can shift between refreshes.
Source: HRSA Data Warehouse PlainHealthAccess is not affiliated with HRSA or any government agency
Download the HRSA shortage-designation extract cited on this page: hrsa-shortage-designations.csv or the JSON distribution (CC BY 4.0). Method notes live on /methodology and /data.
Embed or reuse this visual
Choose the live iframe or a static PNG. Both snippets preserve a source-linked PlainHealthAccess attribution; the PNG link is marked nofollow under the site’s passive-citability policy.
Live iframe
<iframe src="https://plainhealthaccess.com/embed/shortage-profile?scope=rankings" title="US healthcare shortage designation rankings" width="100%" height="420" loading="lazy"></iframe>Static PNG
<figure><a href="https://plainhealthaccess.com/rankings" rel="nofollow noopener"><img src="https://plainhealthaccess.com/og/rankings.png" alt="US healthcare shortage designation rankings" width="1200" height="630" loading="lazy"></a><figcaption>US healthcare shortage designation rankings. Source: HRSA Data Warehouse via PlainHealthAccess.</figcaption></figure>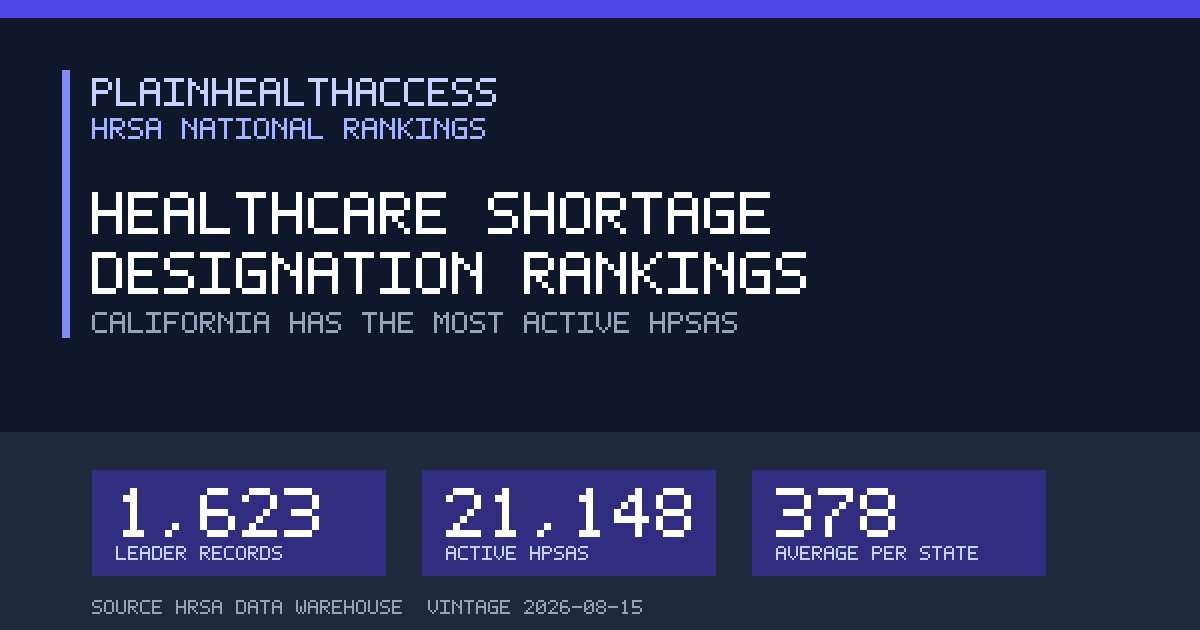
Every figure on PlainHealthAccess is rendered directly from HRSA source data, no number is typed in by an editor. These rankings count ACTIVE HRSA designations only; withdrawn or expired HPSAs are excluded, and relative order can shift when HRSA refreshes the warehouse. See our editorial standards & corrections policy, the methodology behind these numbers, review the public data changelog, or report a data issue for this page. Data current as of August 2026.